Course Notes
You can detail what you learned in the session within these pages. You can also use the Rmd markdown language and insert code chunks with CMD/CTRL + SHIFT + I.
Session 1
Session 2
Session 3
Session 4
What will my data look like?
I’m interested in knowing what effects writing center use has on student writing. So, for this project, I’ve collected participants’ writing before they began courses at Wake (via the Directed Self Placement), data on how frequently they use the writing center, and an essay they completed in Writing 111 (the same essay task for all participants). To analyze the essay, I’m using the web-based tool Coh-Metrix (http://cohmetrix.com). In the future, I’d like to open, read, and count features in the text files directly with R. For my project, each participant has a userid that identifies the semester they completed Writing 111 and their first language. The text analysis data is currently stored in a csv file, where the userids are columns and the text analysis features are the rows.
Tidying my data
I’ve been reading through the tidydata information, and it seems to make sense, but I’ve just starte converting my data. Here’s the print of the word count for each of the DSP essays:
ID feature 1. Label DESWC 2. f18eng001 266 3. f18eng002 280 4. f18eng003 300 5. f18eng004 388 6. f18eng005 296 7. f18eng006 320 8. f18eng007 269 9. f18eng008 267 10. f18eng009 301 11. f18ger010 250 12. f18chi011 234 13. f18chi012 277 14. f18chi013 256 15. f18chi014 252 16. f18chi015 314 17. f18chi016 260 18. f18chi017 300 19. f18chi018 285 20. f18chi019 297 21. f18chi020 263 22. f18chi021 302
There are multiple features I would like to look at for each text (and a total of 70+ generated by the analysis), so I need to figure out the best way to address this with tidydata. Here’s a really messy bar graph with Total Words per pre-arrival essay:
Session 5
Here are rough notes from our January 14 R data session
Types of analysis to consider in our research:
- Inference (hypothesis testing)
- Exploratory analysis - What kind of relationships may exist? e.g., Exploratory factor analysis
- Prediction model - is there a consistent model that you can use to make automatic decisions
Post reading question on reading metrics and other text analysis tools
Syntactic parsing in R see: udpipe also package called usethis -
To write papers using R, check out tufte packages
Discussion board is a good place to ask questions.
Recommendation: when you discover something, share it on the discussion board
For information on Regular Expressions: https://regex101.com/
To calculate TTR for different size texts, see tools/documentation in koRpus package
probably have to tag or transform texts before you can analyze them in korpus
udpipe - can tag texts
Session 6
These are my very rough, stream-of-consciousness notes from our February 4th meeting:
fs - package file structure
In order to run code in an Rmd document, use this: ‘’’{r } ‘’’
(or use Option+Command+i to insert a chunk of R code)
Can do with bash as well, if you want to include other commands, python, etc.
See Broom library
Tip: If you don’t need a whole library (or to remember where you got a function from), you can use this command to remember (e.g., tidy tool) - broom::tidy(lm.test)
or you can do ?tidy which will tell you about tidy and where it’s from
Writing in R markdown, you can insert some r code (see above {r makeupanameforthischunkofcode}
cable xtra - see this package
read/skip headers in files, see csvy.org
read lines function in readr (what is readr)
Session 7
Jerid’s shared several example studies and his Analyzr package
To follow along, the recommendation is to fork the data package to get functions, package, and datasets.
First example we’re looking at is “Analysis an Inference Example” from the Article dropdown menu. The original UCSB spoken data set (sbc in analyzr)- is not very transparent and complicated (without transparent metadata)
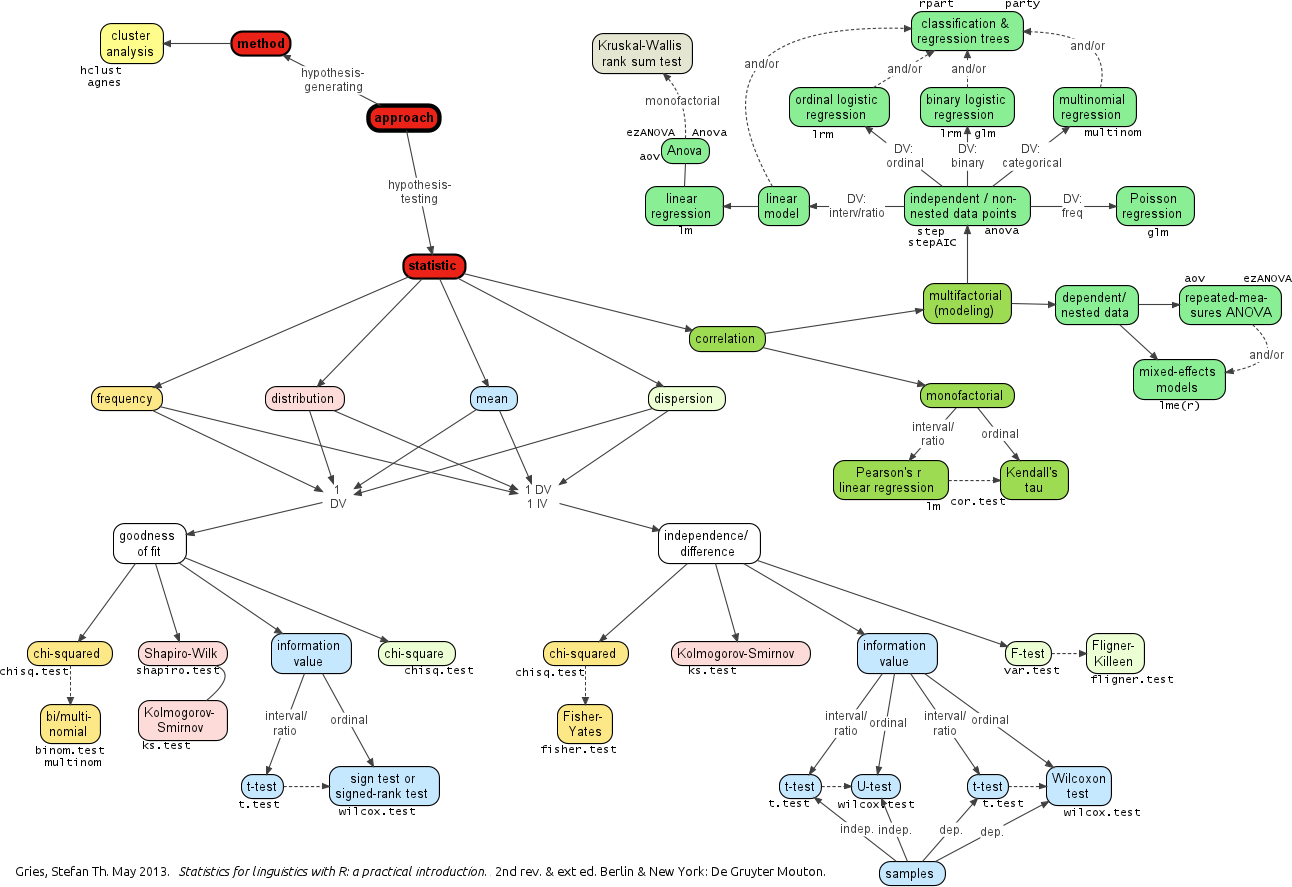
See Stefan Gries’ very useful chart on which statistical measures to use.

Gries chart
See exploratory example here: https://wfu-tlc.github.io/analyzr/articles/analysis-an-exploratory-example.html
Note - Interesting tool to use instead of Stop Word lists: Inverse document frequency - how much does a word occur across multiple documents. Then inverse it to see which words are common but not interesting vs those that are frequent but NOT interesting (uses Pearson correlation). Every register has a coefficient score.
Session 8
References
Copyright © 2018 Jon Smart. All rights reserved.